Chapter 7 Visualizing Spatial Data
7.1 Lesson Goals
- Explore a couple mapping libraries in R
R is fantastic for making publication quality static maps, and for generating repetitive graphics through scripts, and we’ve shown the use of base plotting and using ggplot for making maps already. There are also a number of packages in R that link R code to plotting libraries developed in Javascript (or other languages) for interactive plotting and web integration.
7.1.1 Chorpleths with tmap
Load tidycensus - you’ll need to set your Census API key. A key can be obtained from here. Here we make a choropleth map of median household income in Travis county in Texas.
## Linking to GEOS 3.8.0, GDAL 3.0.4, PROJ 6.3.1## Warning: package 'tidycensus' was built under R version 4.0.2library(tidycensus)
library(tmap)
options(tigris_use_cache = FALSE)
austin_tracts <- get_acs(state = 'TX', county = 'Travis', geography = "tract",
variables = "B19013_001", geometry = TRUE)
tm_shape(austin_tracts) + tm_polygons("estimate")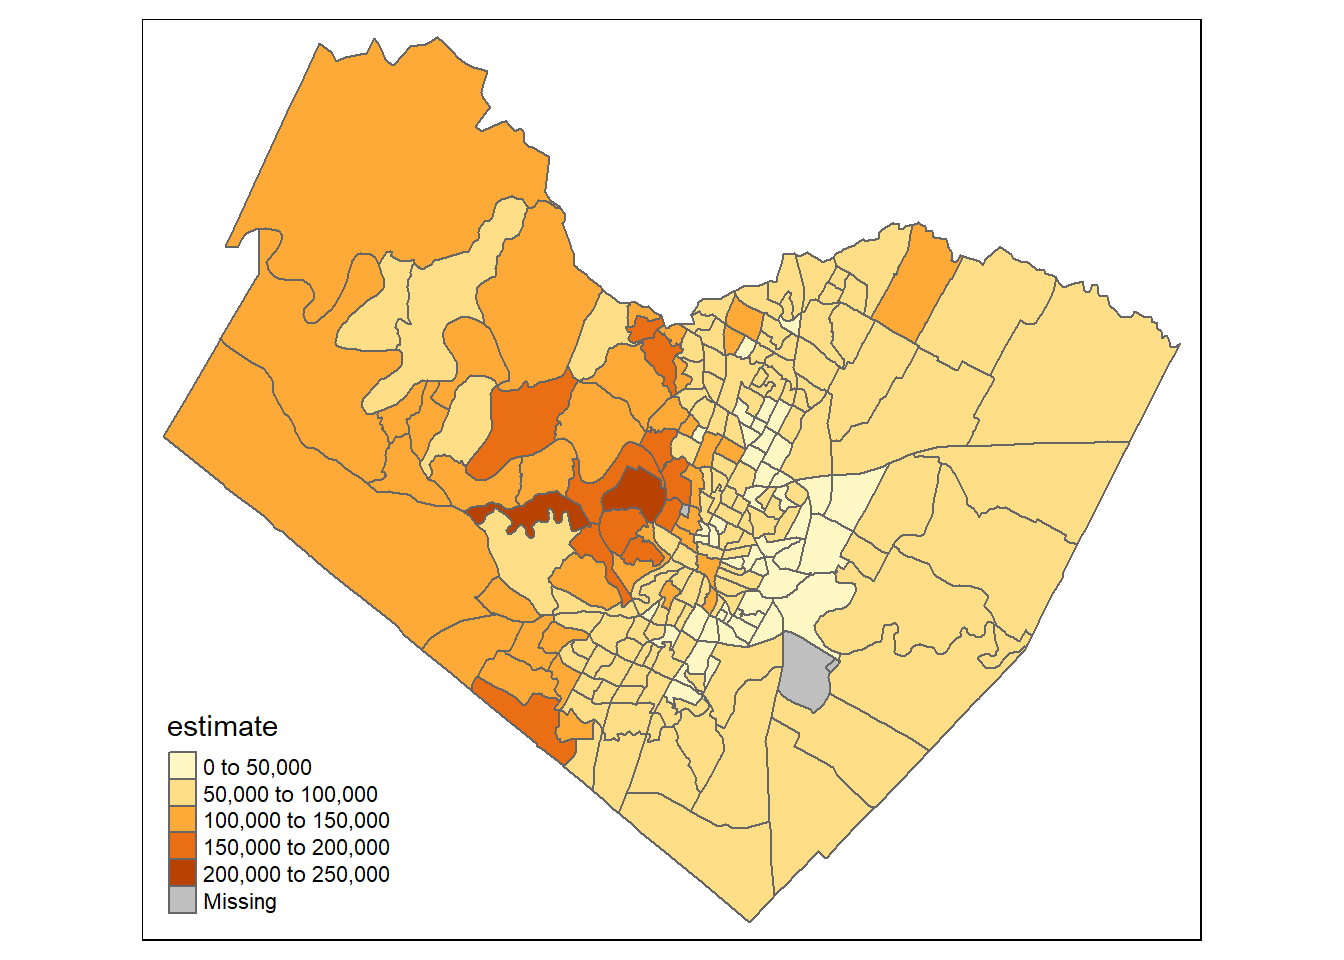
7.1.2 Leaflet
Leaflet is an extremely popular open-source javascript library for interactive web mapping, and the leaflet R package allows R users to create Leaflet maps from R. Leaflet can plot sf or sp objects, or x / y coordinates, and can plot points, lines or polygons. There are a number of base layers you can choose from. It’s worth spending some time exploring the excellent Leaflet for R site.
Here we make the simplest of leaflet maps:
7.1.3 mapview
Mapview is a package designed for quick and easy interactive visualizations of spatial data - it makes use of leaflet but simplifies mapping functions compared to the leaflet package.
It’s easy to layer features with mapview - you can supply a list of objects to mapview or use + syntax as with ggplot.